
ETH/USD – Ethereum Resting At Trend Line Support
Key Support Levels: $377, $364, $360.
Key Resistance Levels: $390, $400, $410.
Ethereum struggled to break the resistance at $416 (bearish .618 Fib) earlier in October which saw the coin heading lower this the past week. During the weekend, Ethereum managed to rebound from $380 and push as high as $390.
Today, the bulls spiked above $400 but the coin has since dropped to the current level at $380. It is resting at the support provided by a 5-week-old rising trend line. If today’s candle closes as it is, ETH would have printed a bearish engulfing candle, and it would likely head lower beneath this current trend line.
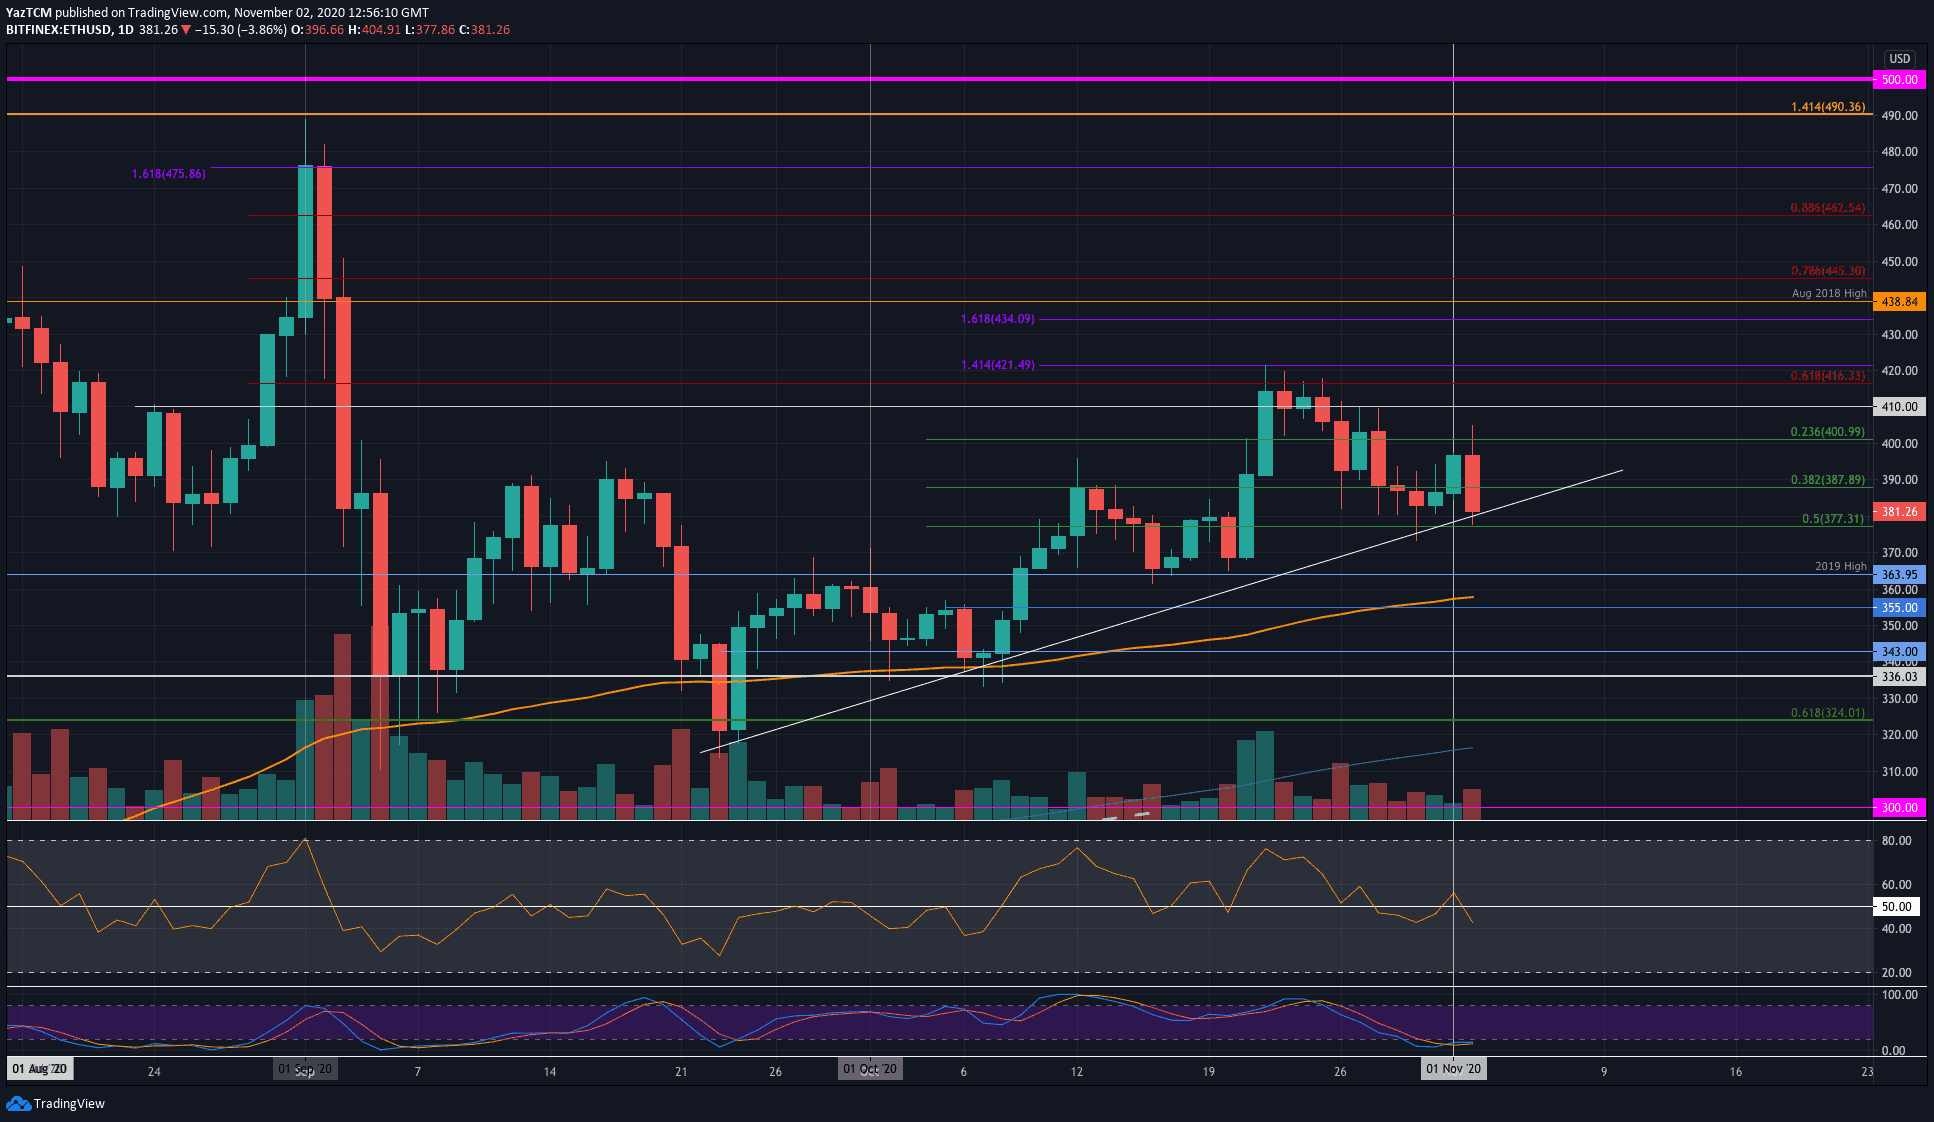
ETH-USD Short Term Price Prediction
Looking ahead, if the sellers break beneath the trend line, the first level of support lies at $377 (.5 Fib). Added support is then found at $364 (2019 High), $360 (100-days EMA), $255, and $243.
On the other side, if the buyers rebound from the trend line, the first level of resistance lies at $390. Following this, resistance lies at $400, $410, and $416.
The RSI dipped back beneath the mid-line as the sellers control the market momentum. The Stochastic RSI is extremely oversold and a bullish crossover signal should put an end to the downward pressure.
ETH/BTC – Sellers In Control Beneath 200-days EMA
Key Support Levels: 0.0284 BTC, 0.0278 BTC, 0.027 BTC.
Key Resistance Levels: 0.0292 BTC, 0.0296 BTC 0.03 BTC.
Against Bitcoin, Ethereum continued to fall last week as it dropped beneath the February 2020 Highs at 0.0284 BTC. The coin continued to drop until support was found at 0.0278 BTC this weekend which allowed it to rebound yesterday.
The coin pushed as high as 0.0288 BTC and spiked above 0.029 BTC but has since returned to the 0.0284 BTC level (Feb 2020 High).
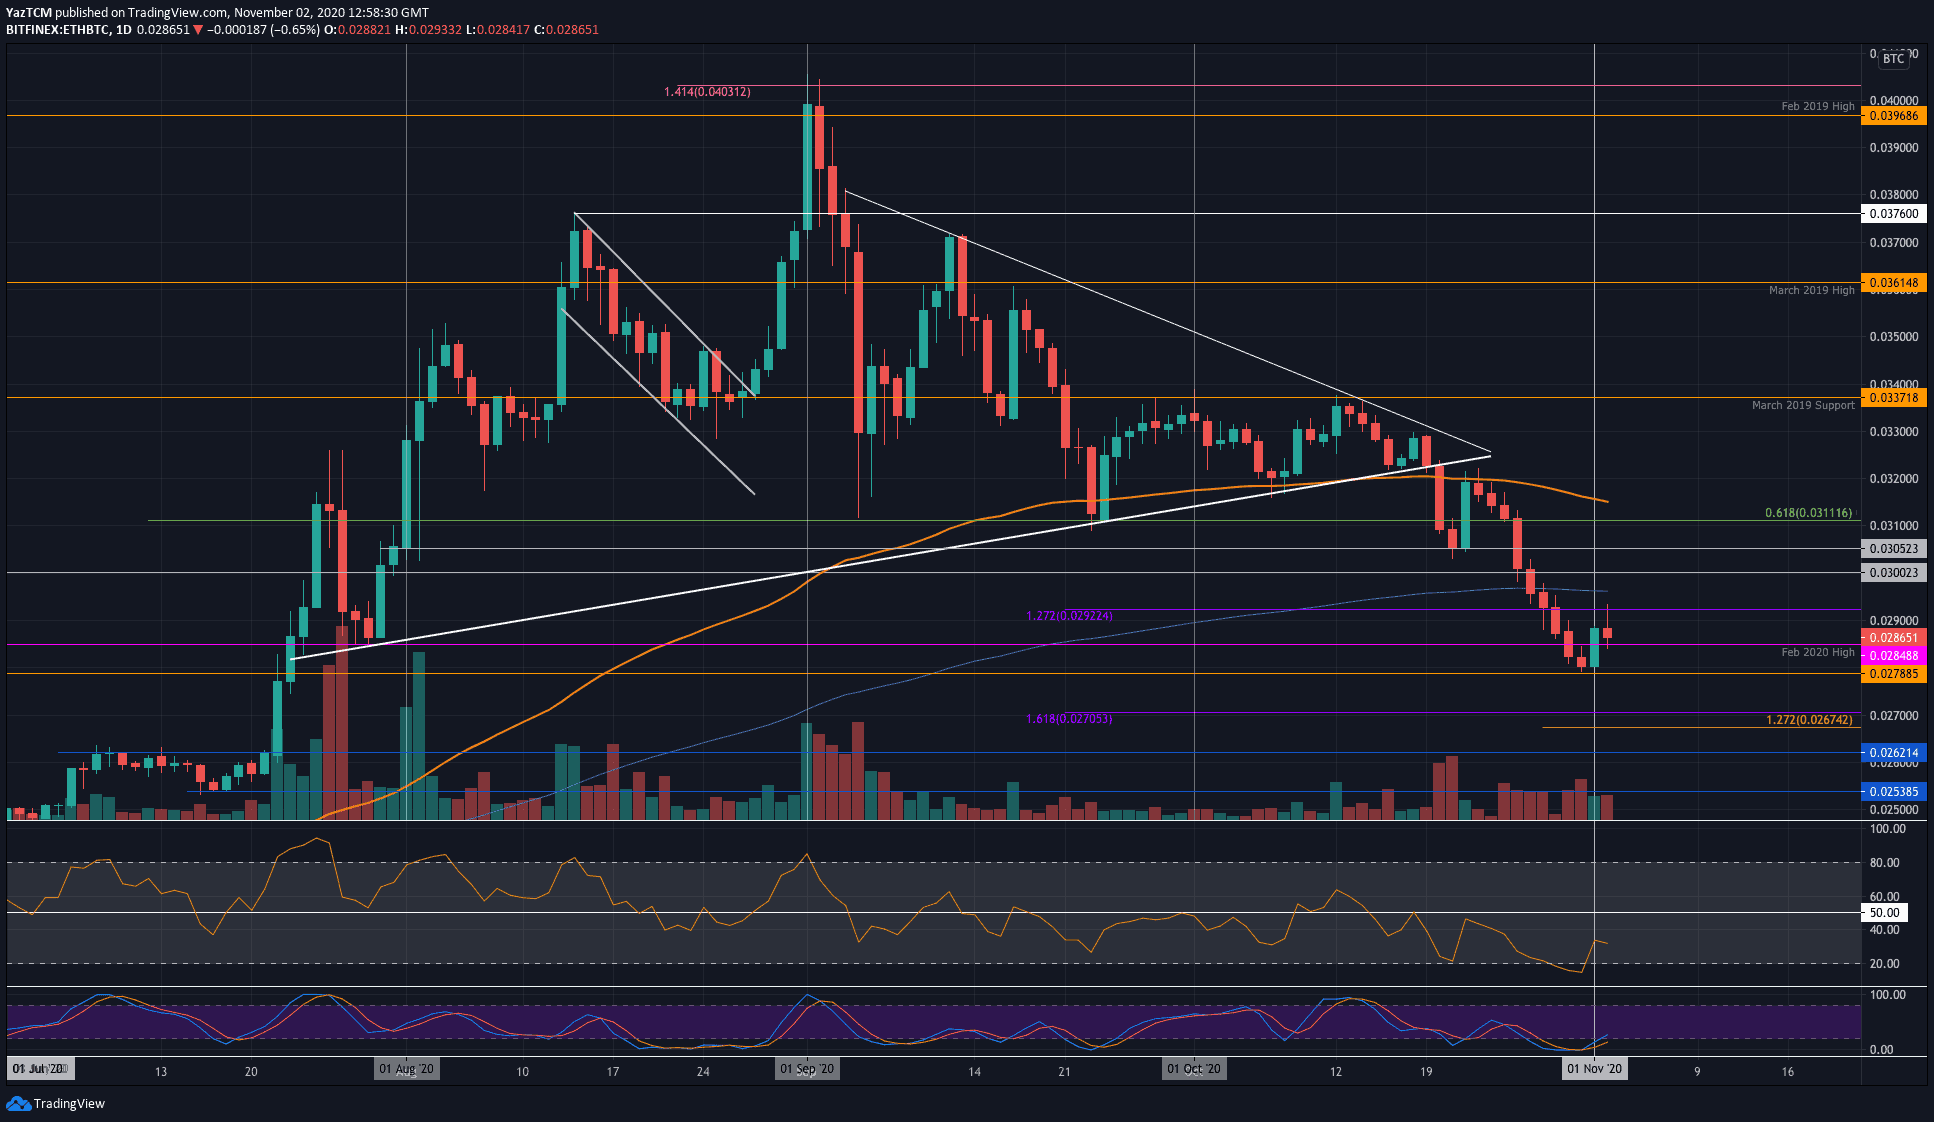
ETH-BTC Short Term Price Prediction
Looking ahead, if the sellers break beneath the 0.0284 BTC support again, additional support is found at 0.0278 BTC, 0.027 BTC, and 0.0262 BTC.
On the other side, resistance lies at 0.0292 BTC, 0.0296 BTC (200-days EMA), and 0.03 BTC.
The RSI is well beneath the mid-line as the sellers dominate the market momentum. However, the Stochastic RSI produced a bullish crossover signal which is a promising sign for the bulls.
Binance Futures 50 USDT FREE Voucher: Use this link to register & get 10% off fees and 50 USDT when trading 500 USDT (limited offer).
Disclaimer: Information found on CryptoPotato is those of writers quoted. It does not represent the opinions of CryptoPotato on whether to buy, sell, or hold any investments. You are advised to conduct your own research before making any investment decisions. Use provided information at your own risk. See Disclaimer for more information.
Cryptocurrency charts by TradingView.
Tagged with: BLOCKCHAIN NEWS • crypto news


