
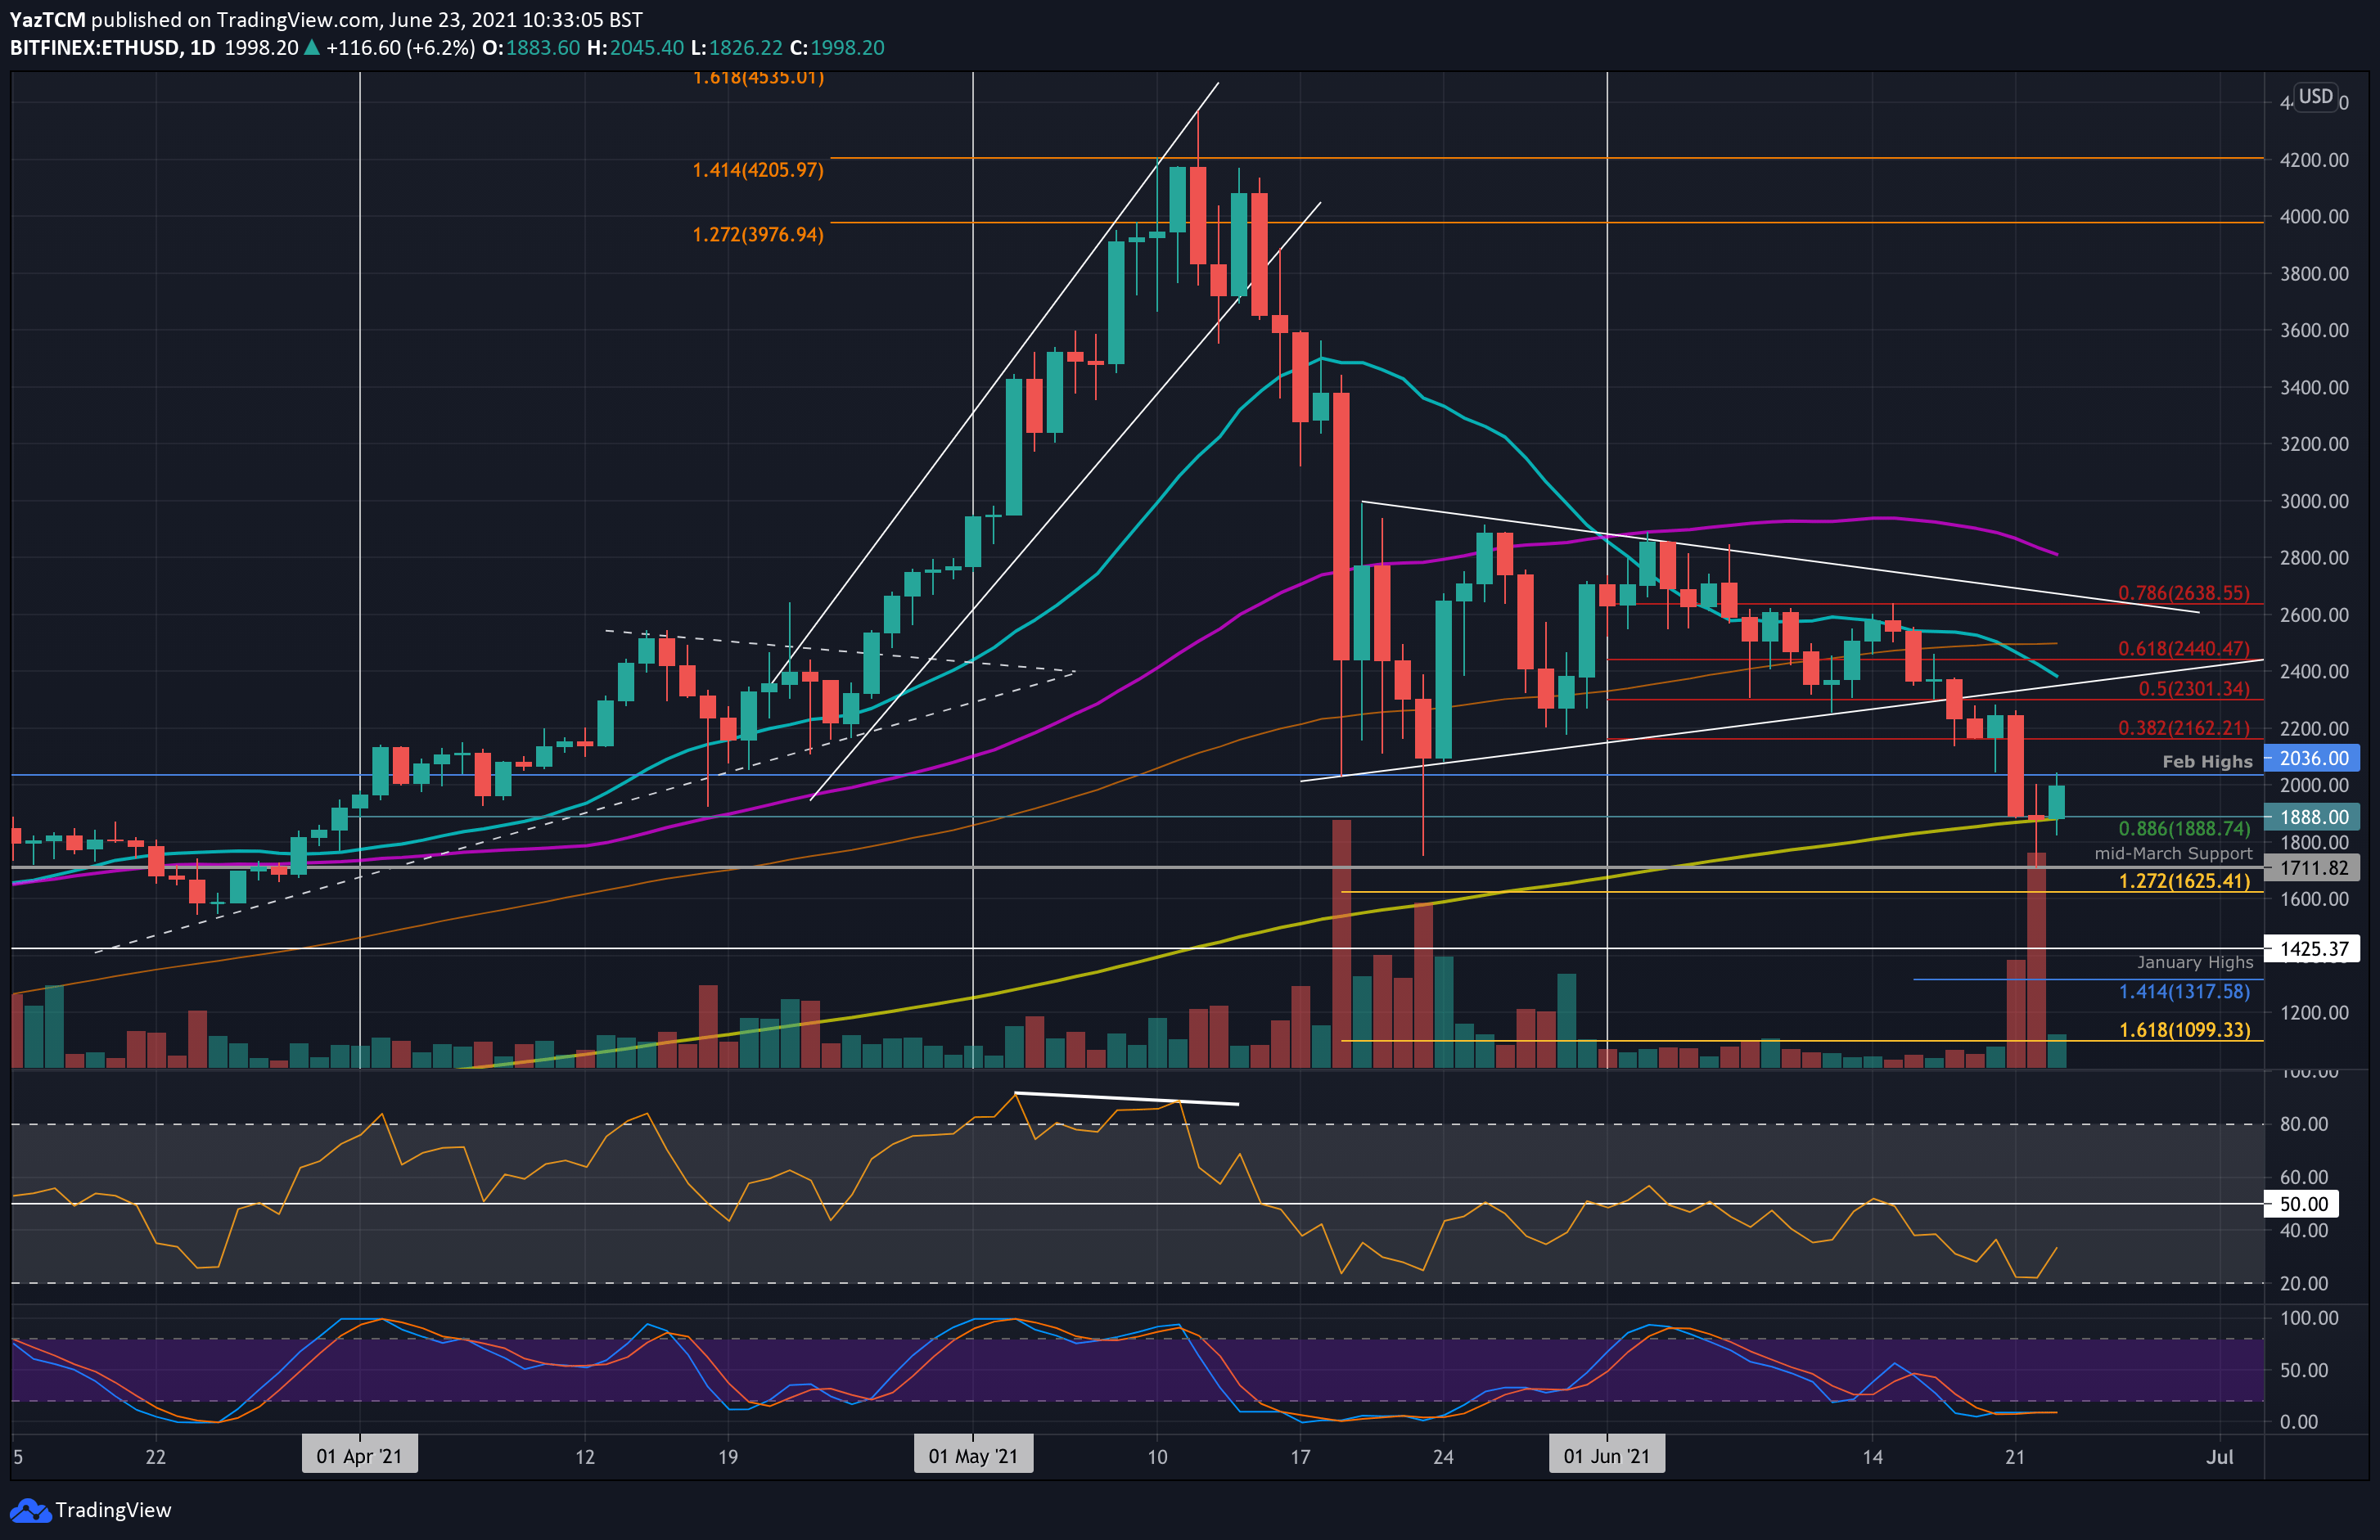
ETH/USD – Ether Rebounds From 200-day MA Support
Key Support Levels: $1888, $1710, $1625.
Key Resistance Levels: $2160, $2300, $2400.
Ethereum dropped beneath its consolidation pattern toward the end of last week and fell into the support around $2150 over the weekend. Unfortunately, on Monday, ETH slipped beneath $2200 and continued lower until finding support at $1,888, provided by the 200-day MA.
Yesterday, the brief BTC dip beneath $30K caused ETH to slip below the 200-day MA and reach as low as $1710 – mid-March support. However, ETH had rebounded and closed back above the 200-day MA by the end of the day.
Today, the bulls are attempting to push higher to reclaim the 200-day MA level.
ETH-USD Short Term Price Prediction
Looking ahead, if the buyers can reclaim $2000, the first resistance lies at $2162 (bearish .382 Fib). This is followed by $2300 (bearish .5 Fib), $2400 (20-day MA), and $2500 (100-day MA).
On the other side, the first support lies at $1888 (200-day MA &.886 Fib). This is followed by $1710, $1625 (downside 1.272 Fib Extension), and $1425 (Jan 21 highs).
The RSI rebounded from oversold conditions today, indicating the bearish pressure is starting to ease up. However, the momentum is still far from becoming bullish just yet.
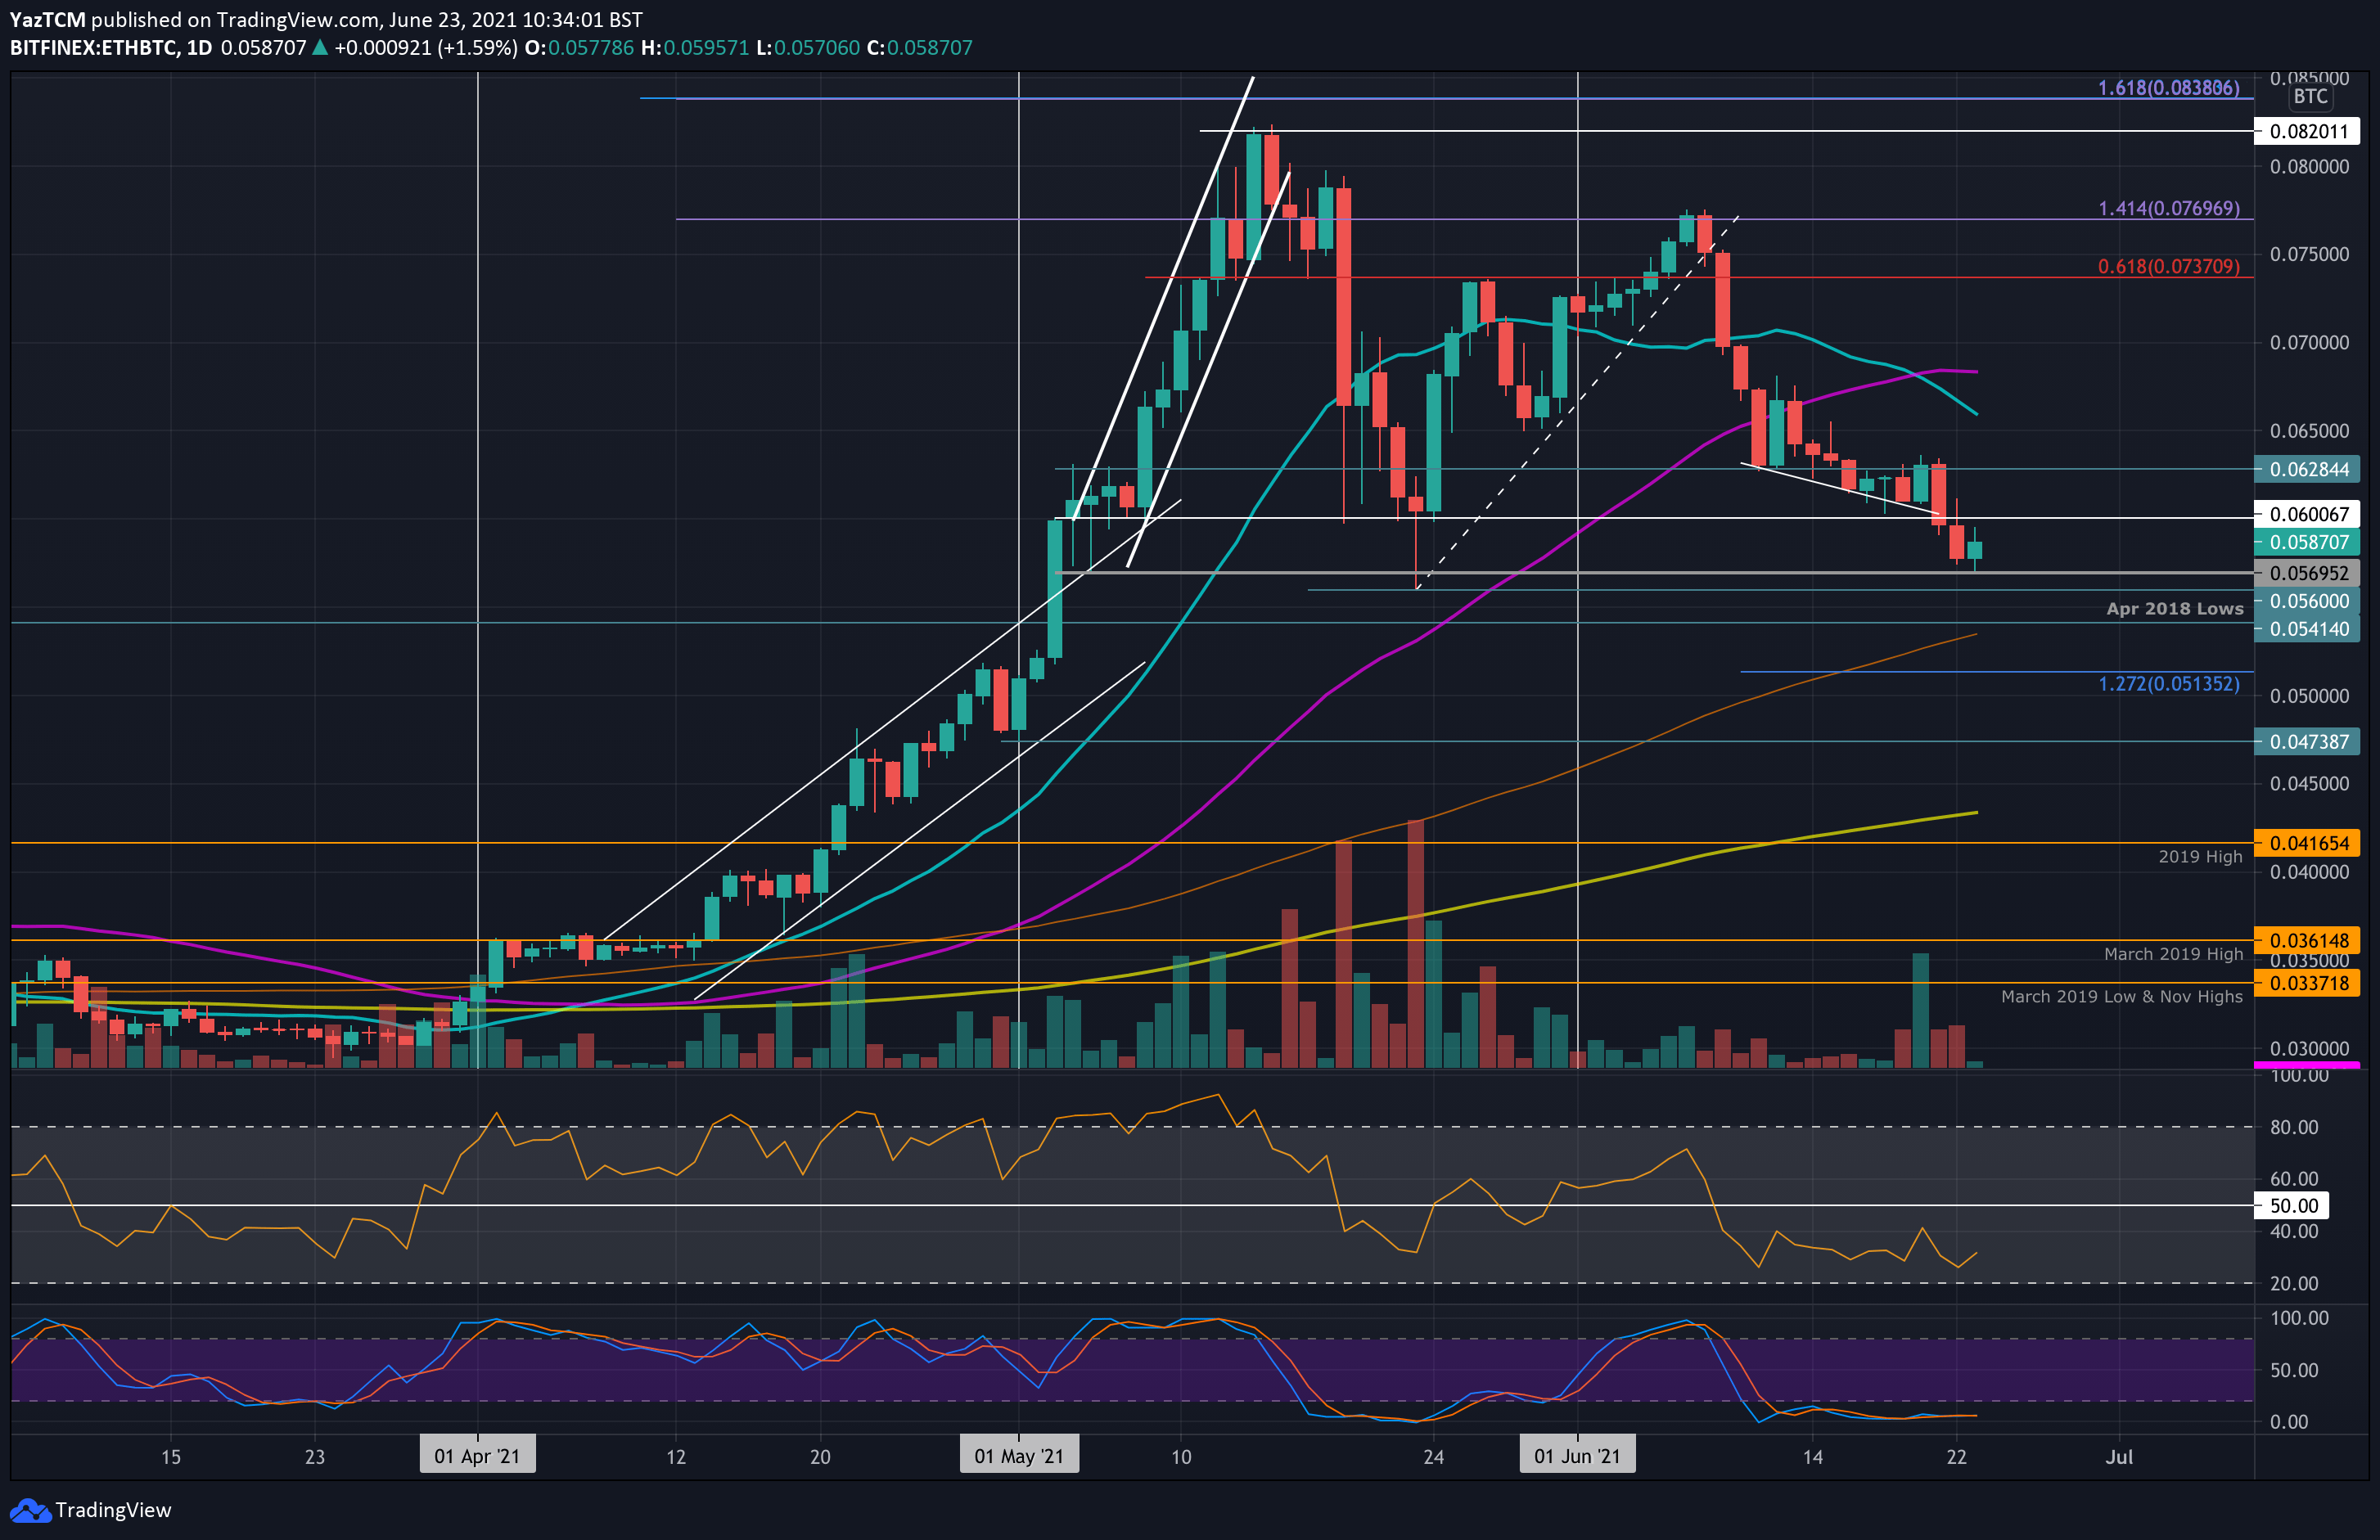
ETH/BTC – Bears Break 0.06 BTC Support
Key Support Levels: 0.056 BTC, 0.0541 BTC, 0.0513 BTC
Key Resistance Levels: 0.06 BTC, 0.063 BTC, 0.065 BTC.
Etheruem has been struggling against BTC throughout June. It failed to break resistance at 0.077 BTC at the beginning of the month and has been heading lower ever since.
Yesterday, ETH broke cleanly beneath the support at 0.06 BTC and continued to drop until find support at 0.0569 BTC today. It has since bounced to 0.0587 BTC as it heads back to 0.06 BTC.
ETH-BTC Short Term Price Prediction
Moving forward, the first resistance lies at 0.06 BTC. This is followed by 0.063 BTC, 0.065 BTC (20-day MA), and 0.068 BTC (50-day MA).
On the other side, the first strong support lies at 0.056 BTC (late-May lows). This is followed by 0.0541 BTC (April 2018 lows & 100-day MA), 0.0513 BTC (downside 1.272 Fib Extension), and 0.05 BTC.
The RSI is still heavily bearish, but today’s uptick might be the first signal that the momentum is starting to shift. It would need to head back above the 50 level before the bulls can start a recovery.
Binance Futures 50 USDT FREE Voucher: Use this link to register & get 10% off fees and 50 USDT when trading 500 USDT (limited offer).
PrimeXBT Special Offer: Use this link to register & enter POTATO50 code to get 50% free bonus on any deposit up to 1 BTC.
Disclaimer: Information found on CryptoPotato is those of writers quoted. It does not represent the opinions of CryptoPotato on whether to buy, sell, or hold any investments. You are advised to conduct your own research before making any investment decisions. Use provided information at your own risk. See Disclaimer for more information.
Cryptocurrency charts by TradingView.
Tagged with: BLOCKCHAIN NEWS • crypto news


